2 min read
According to a study conducted by the British Retail Consortium, the weather has the biggest influence on consumer behavior after the economy. Its effect on purchase decision reaches well beyond the obvious examples of splurging on ice cream on hot days.
2 min read
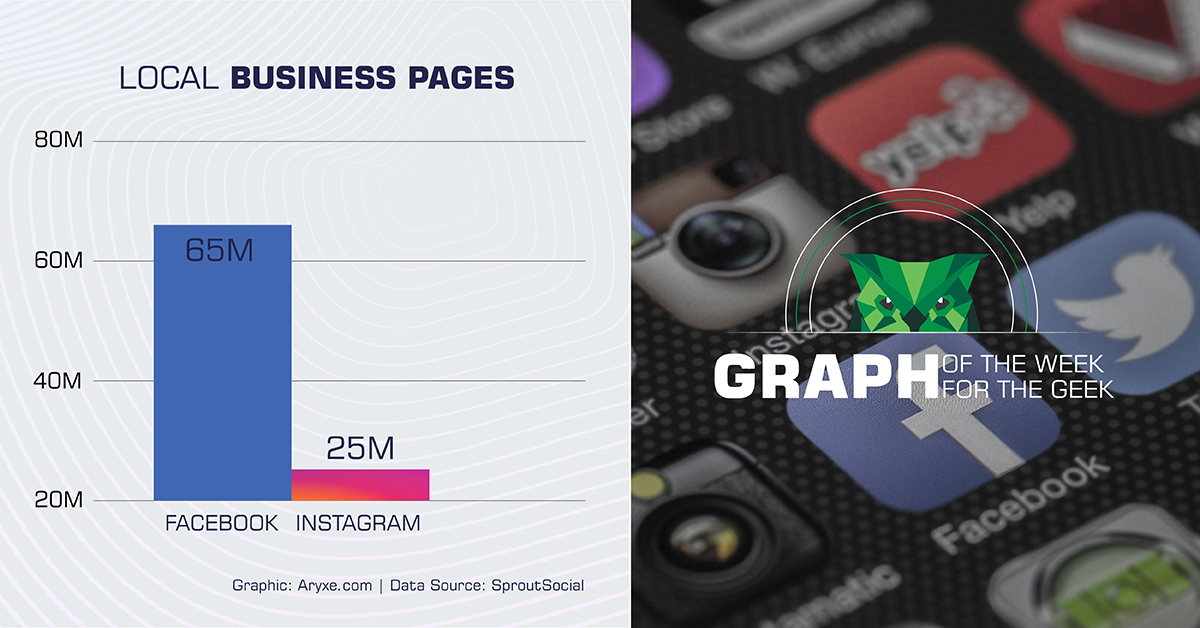
Facebook continues to experience steady growth in users in spite of the occasional fluctuation. And according to the 2018 Sprout Social Index, it remains the most favored social media platform among social marketers.
Instagram, on the other hand, notes a rapid and explosive growth, having reached 1 billion users in 2018. The platform has also undergone plenty of changes in terms of features and interface, enabling many options for advertisers.
To stay ahead of the curve in 2019, take a look at the most significant statistics for both platforms:
2 min read
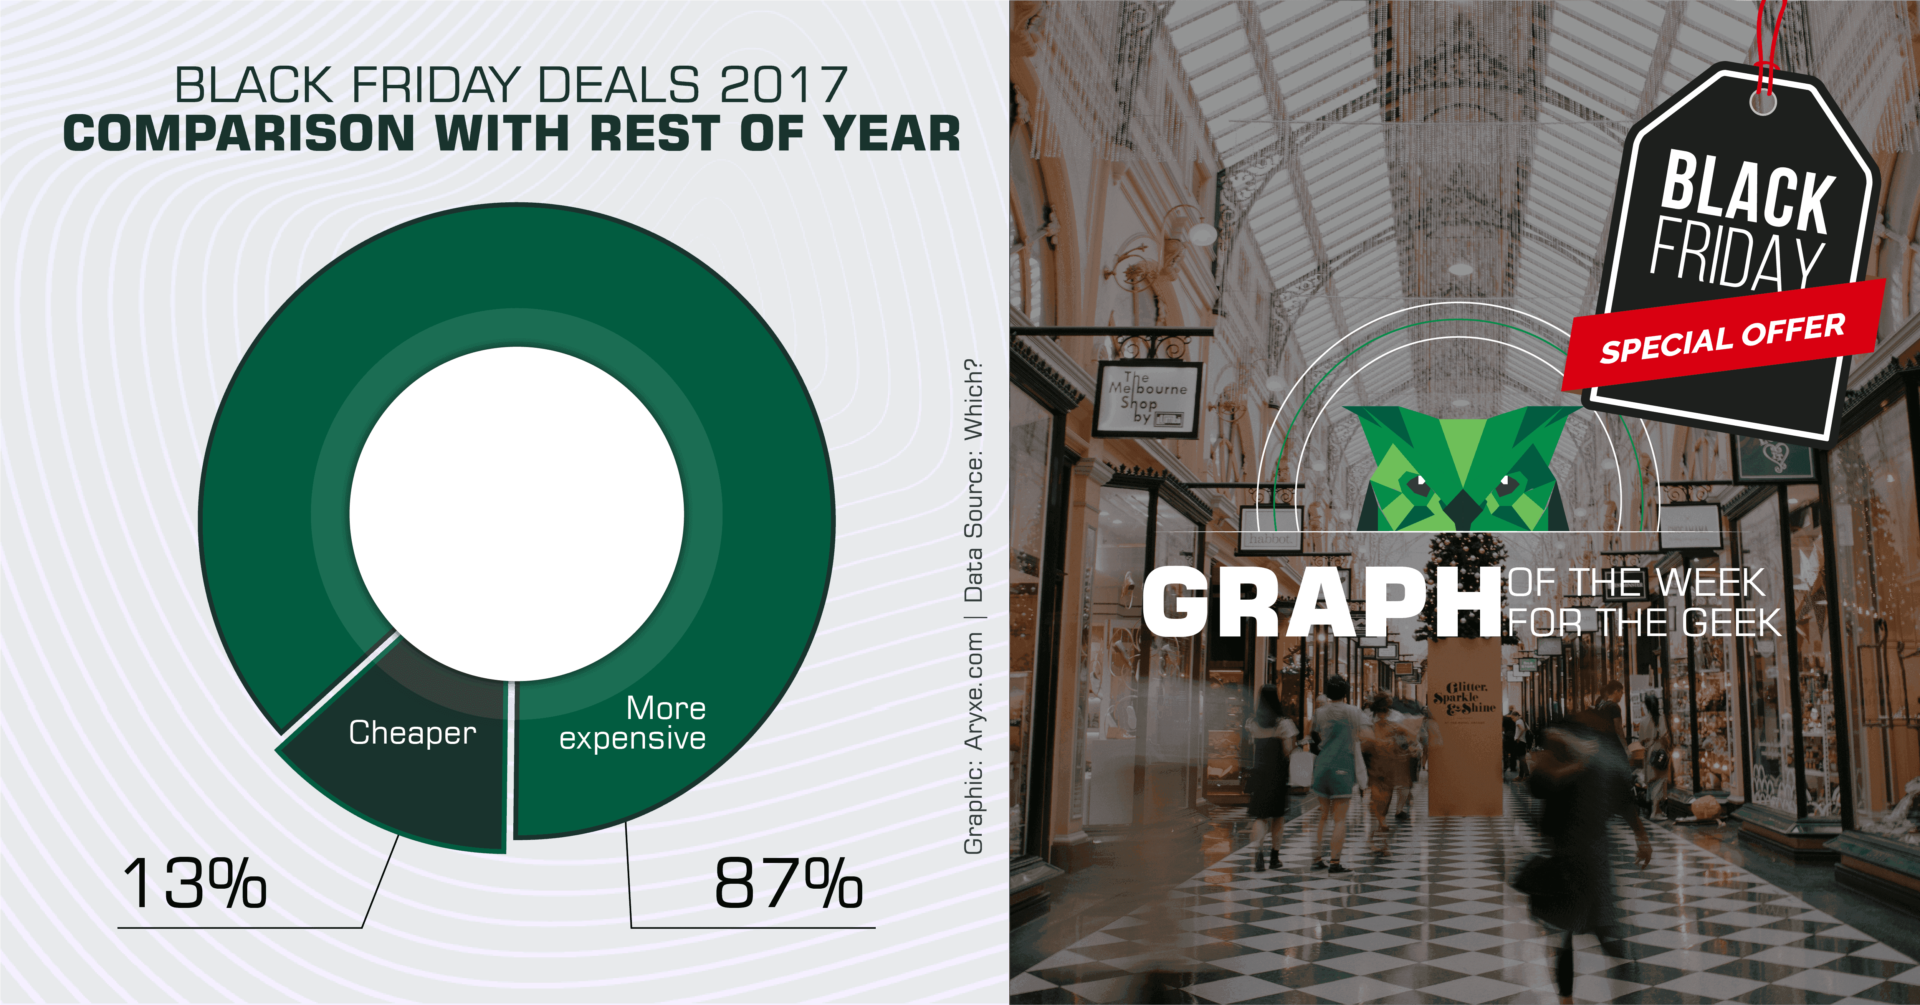
Black Friday is historically known as the single day in the year when retailers slash the prices of their products in an attempt to give buyers with the hottest deals. This has prompted many sellers to launch weeks-long campaigns before or after the day and many customers to spend hours browsing for the biggest discounts online and in-store.
2 min read
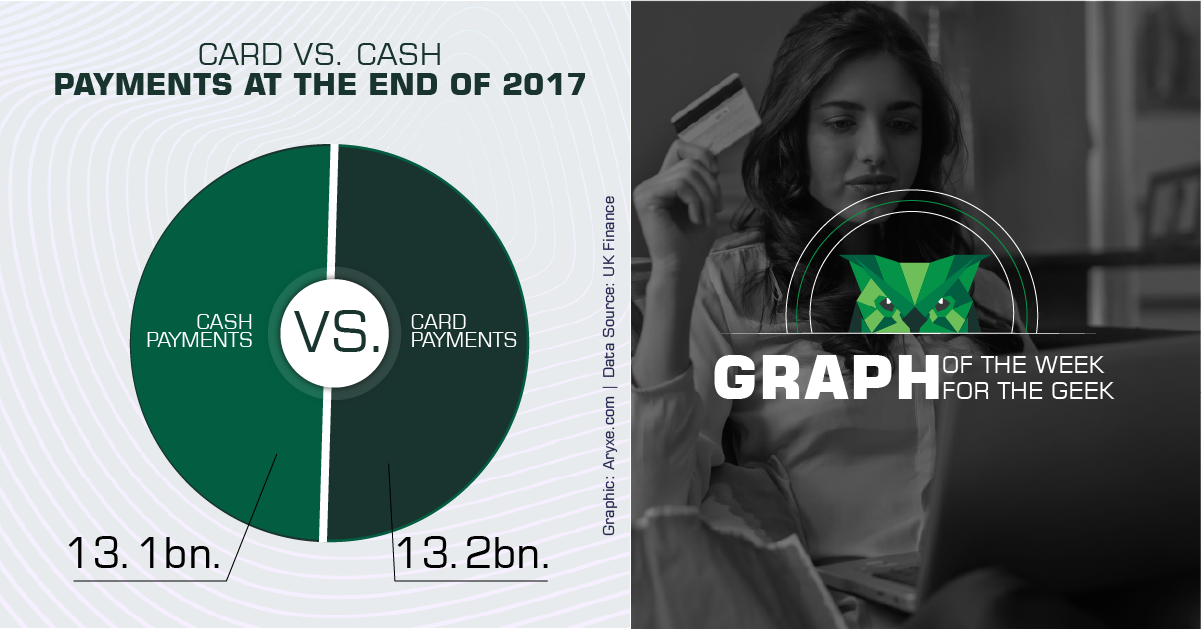
The latest statistics from Finance UK show that last year saw the number of card payments exceed that of cash which proves that the long-established view that “cash is king” may no longer be valid. The trend was facilitated by the surge of contactless payments, which an increasing number of people adapt, hitting 13.2 billion transactions in 2017, compared to 13.1 billion for cash.
3 min read
This week in Graph of the Week we look at Mary Meeker’s 2018 Internet Trends report, an annual overview of how the internet and digital services have developed in the last year. As a natural reflection of the events of the past year, this time the review focused on the protection of user privacy, the boom of e-commerce, China and its role in the digital economy, and work.
2 min read
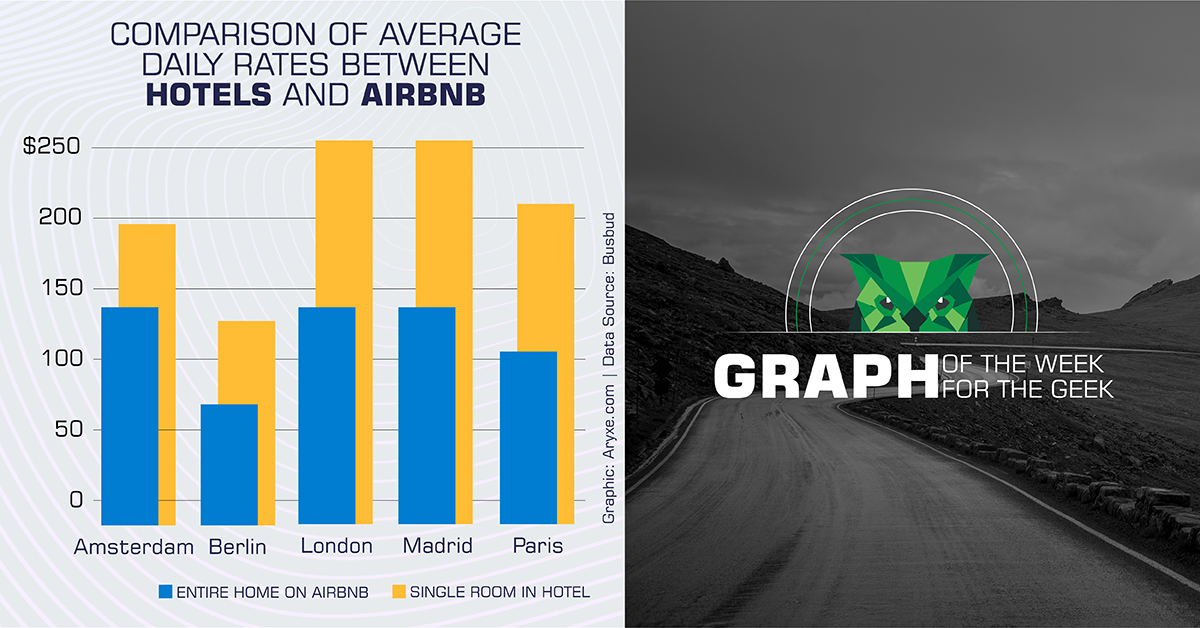
This week in Graph of the Week, we look at how services, such as Airbnb, managed to drive better performance than hotels by comparing the costs of a stay in both of them.